Alerting and monitoring
Modelbit's Slack Alerting integration is recommended for quick and easy alerting on model errors.
For more robust alerting, Modelbit's DataDog integration or with logging webhooks can be paired with pager systems like PagerDuty or OpsGenie.
Diagnosing an alert
To diagnose an alert, first determine if the problem is in Modelbit or in your running model.
Diagnosing Modelbit problems
To determine if a Modelbit production system is having an error, visit the Modelbit Status Page at https://status.modelbit.com:
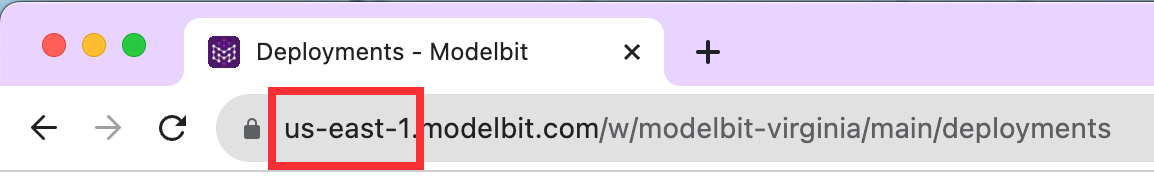
First, determine your region. In your Modelbit account, the first component of the URL shows your region. For example, you might see app, us-east-1, us-east-2.aws, etc.
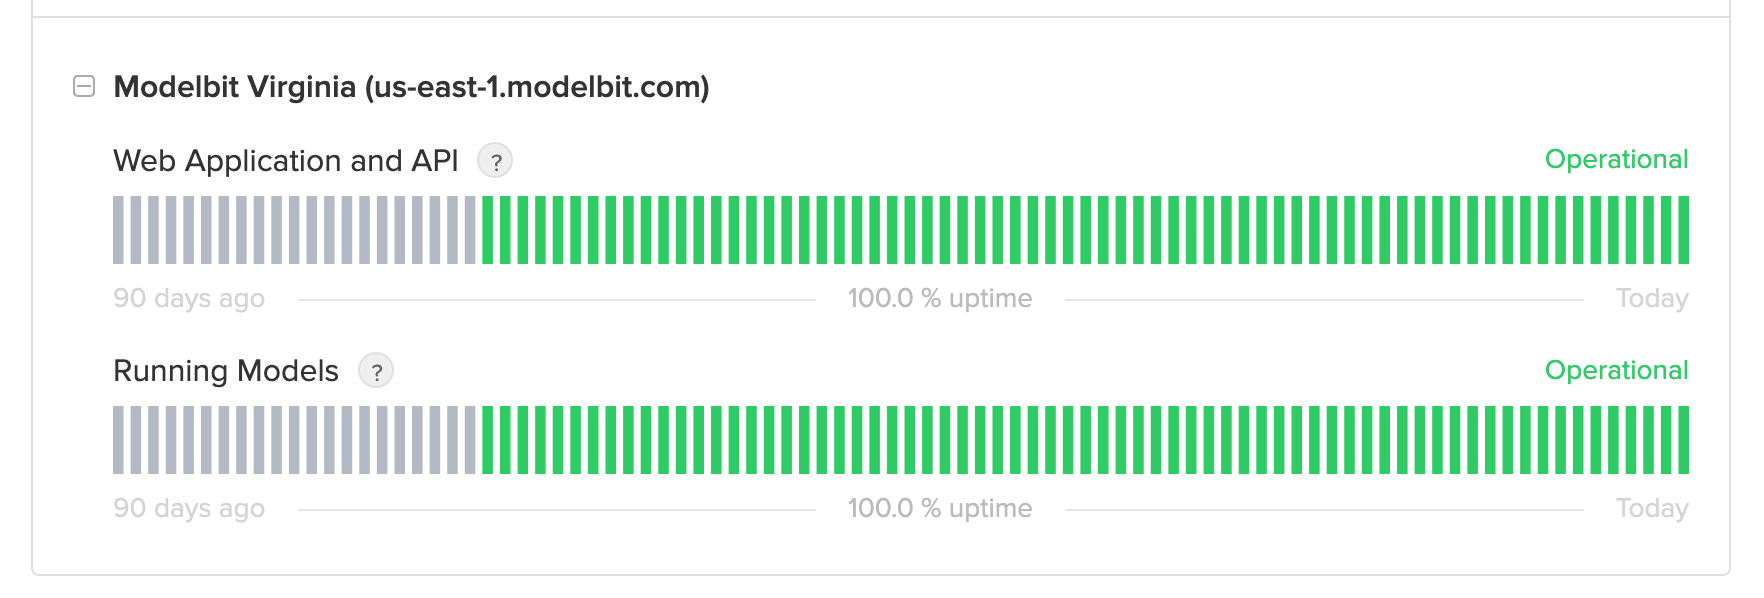
Click the plus icon next to your region on the status page. "Running Models" shows any current issues related to your running models, which is most pertinent when responding to an alert. "Web Application and API" refer to workflows whose loss may be inconvenient but should not impact running models in production:
Diagnosing problems in your models
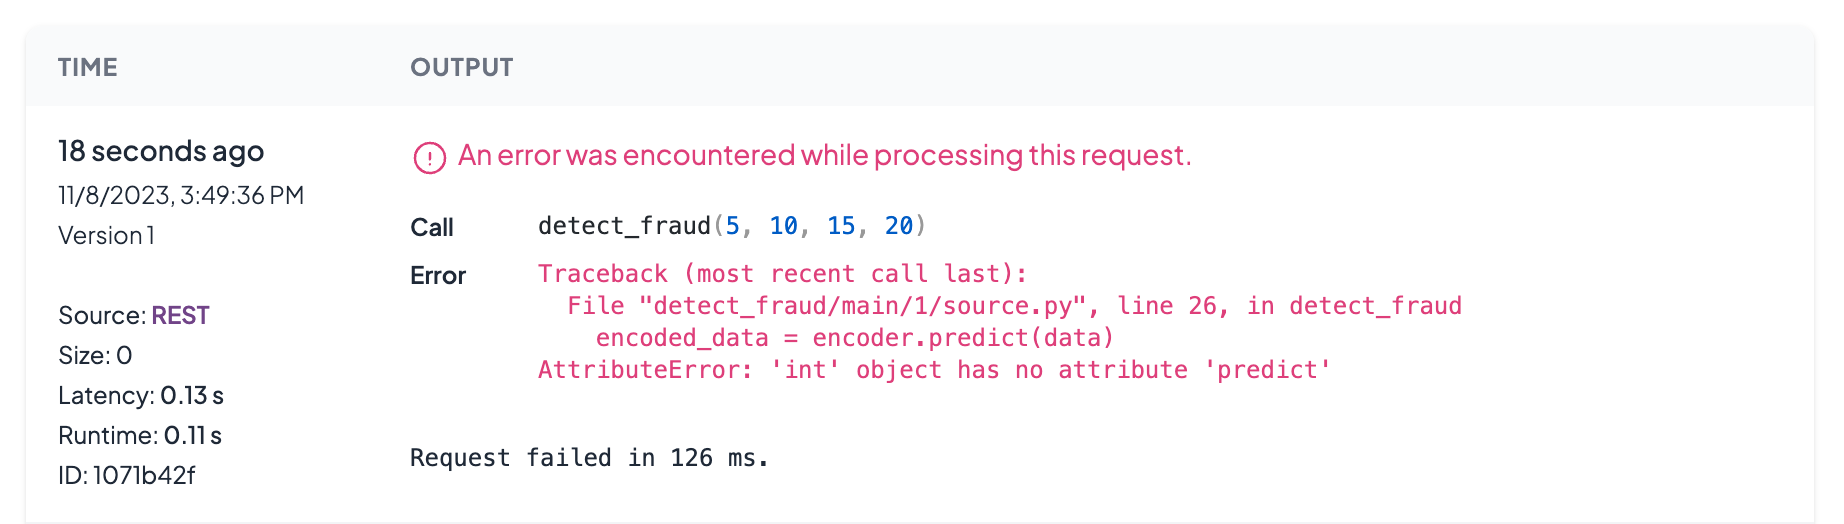
To diagnose problems in your models inside of Modelbit, head to Modelbit's logs viewer for your model. Select your deployment from the list of Deployments and then click "Logs" in the left-hand navigation.
Any errors will be shown in bright red with their full stack trace present:
Escalating to the Modelbit team
Never hesitate to reach out to the Modelbit team for further assistance! Use your shared Slack channel to talk to the team directly.
Enterprise customers can reach the Modelbit team via cell phone. Reach out to your contacts to get the numbers.