Exploring models in Snowsight
Models deployed with Modelbit can be interactively explored in a BI tool like Snowflake's Snowsight. For example, if we deploy a lead scoring model with Modelbit, the sales and marketing team can explore the value of potential leads with an interactive dashboard like this one:
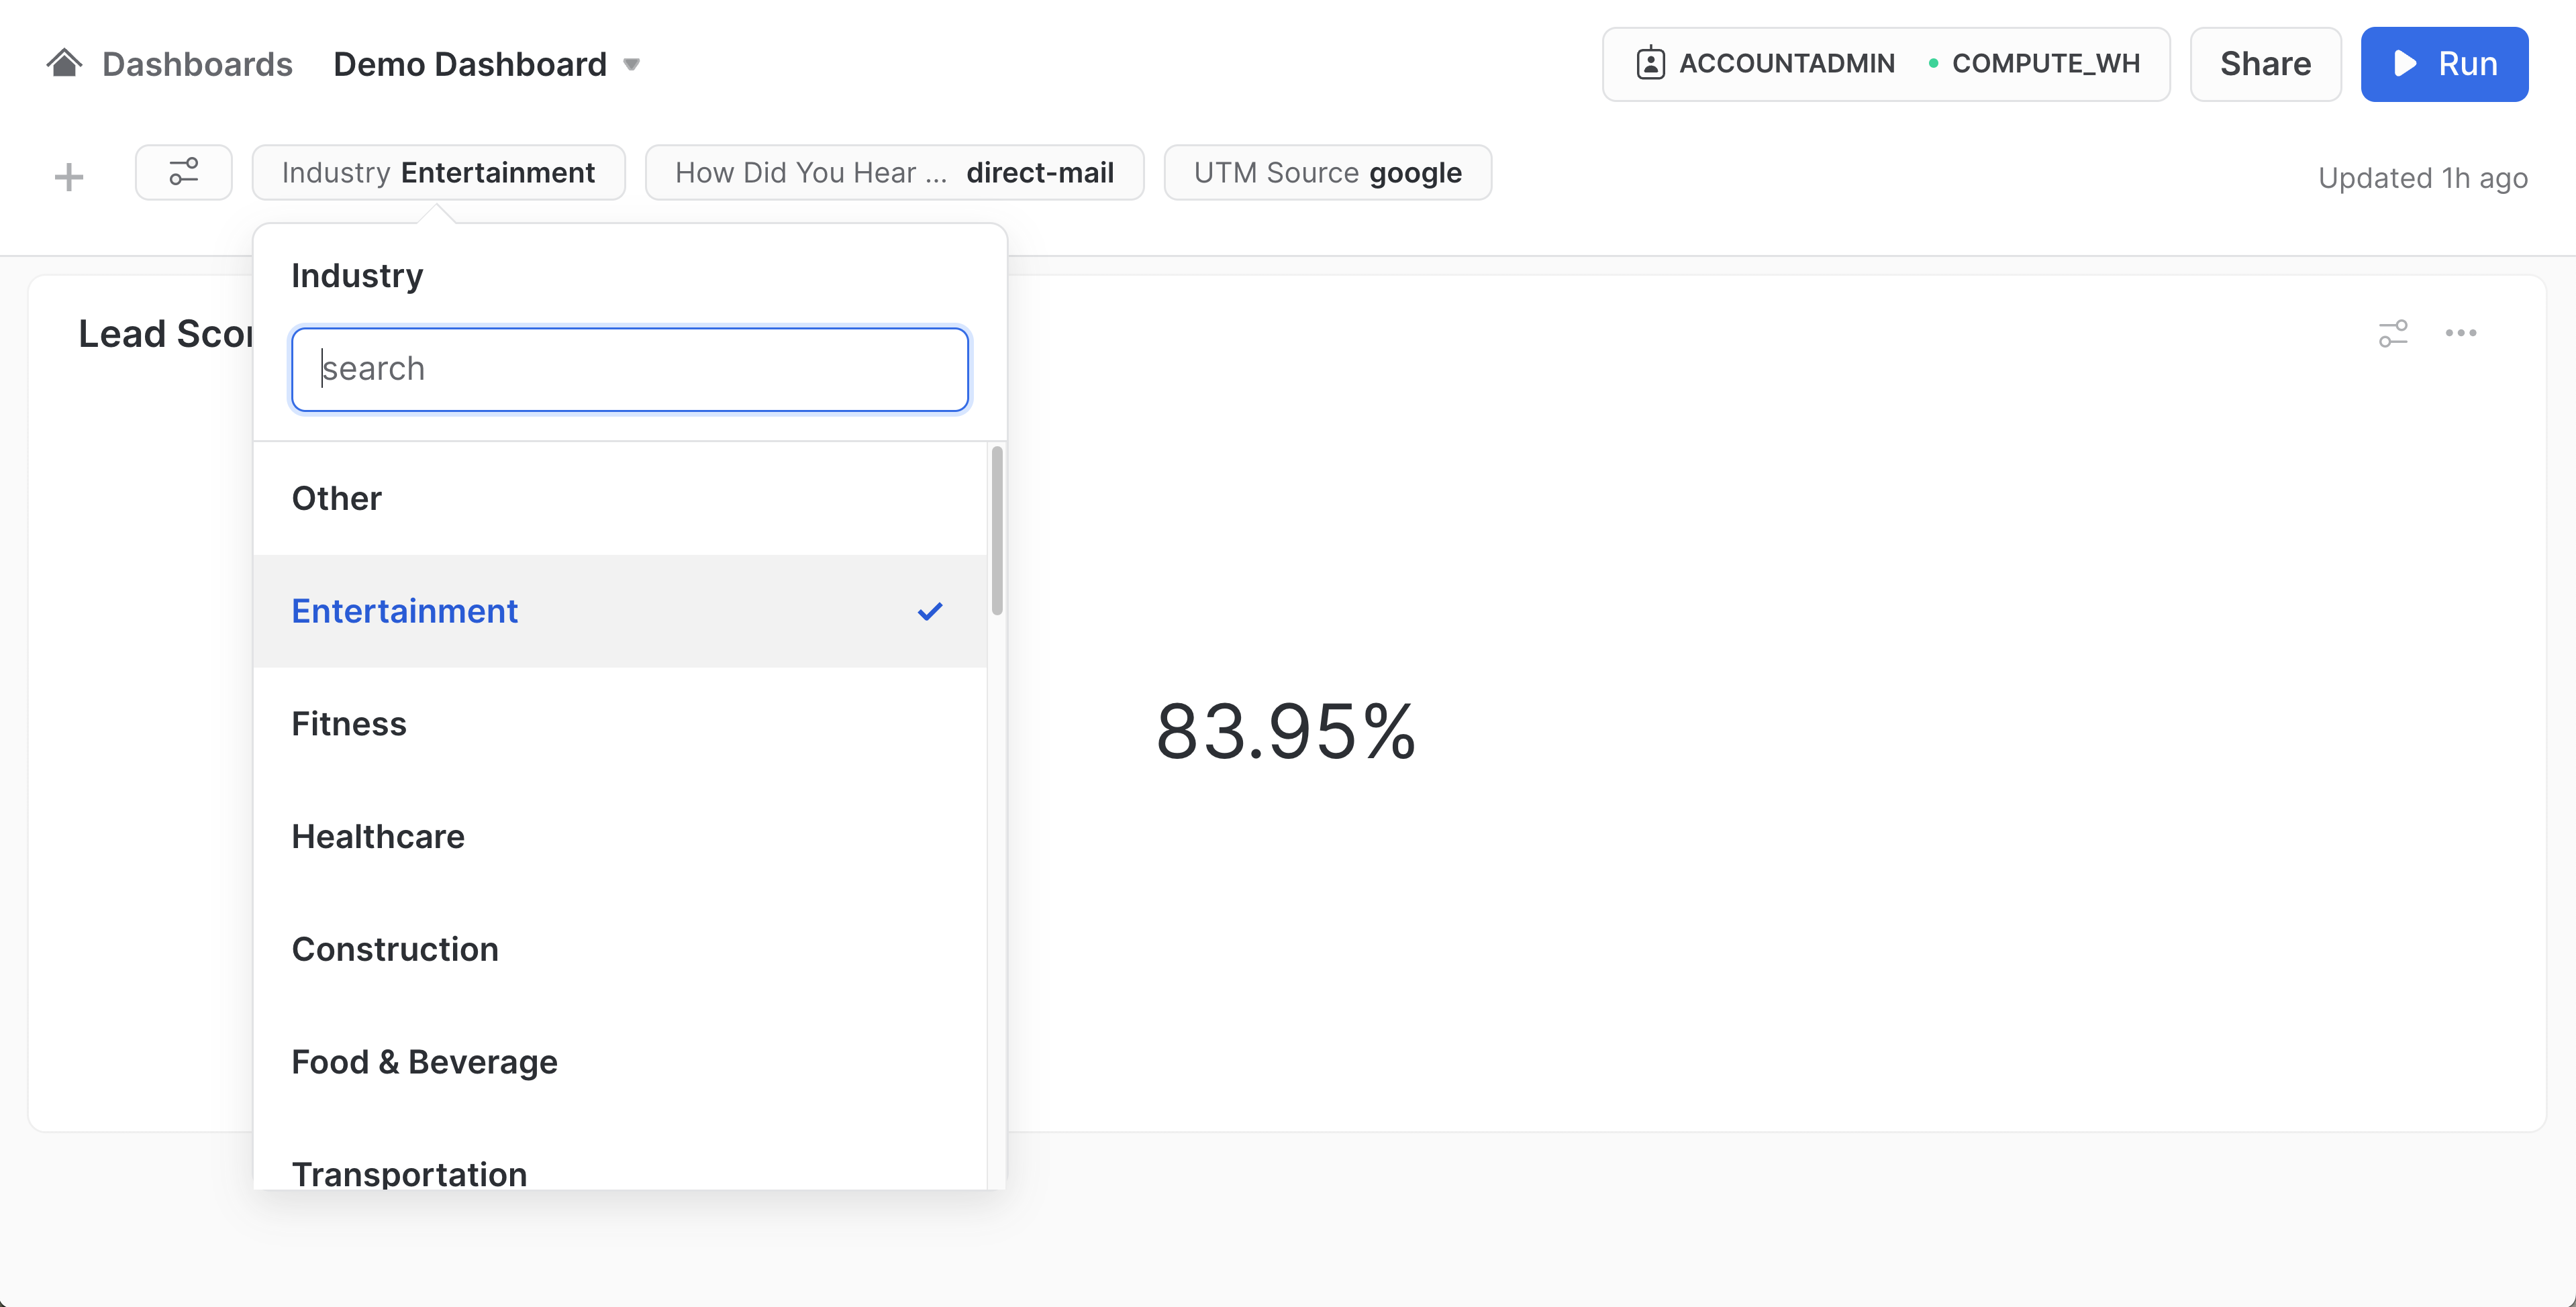
Creating filters for your features
For each feature that gets input to your model, create a filter in Snowsight. After naming the filter, if you want the values to be pre-populated from your database, click the "Write Query" button.
For example, to pre-populate the lead scorer's "Industry" field, write a query like:
select industry from leads where industry is not null;
Then save your filter. Create as many filters as you have features that your model takes at inference time. For our model, that's three filters: hdyhau, `
Creating a chart to explore your Modelbit model
Next, create a chart for your Modelbit model! To start, grab the example SQL query from your Modelbit model's API Endpoints screen.
For our lead scorer, that query is:
select demo_schema.score_sales_lead_latest(
  {
    'HDYHAU': 'podcast',
    'UTM_SOURCE': 'google',
    'INDUSTRY': 'Fitness'
  }
);
Since Snowflake only allows filters in conditionals, and doesn't support direct filter value interpolation, we need to update this query with one subquery per filter.
The full query for the chart looks like this:
with
  u as (select utm_source from leads where utm_source = :utm_source),
  h as (select hdyhau from leads where hdyhau = :hdyhau),
  i as (select industry from leads where industry = :industry)
select demo_schema.score_sales_lead_latest({
  'UTM_SOURCE': (select utm_source from u limit 1),
  'HDYHAU': (select hdyhau from h limit 1),
  'INDUSTRY': (select industry from i limit 1)
});
Putting it all together
Now that you have your filters and your chart, you can select values from the filter dropdowns and click "Run" in the top right to see the inferences change based on new feature values!