Exploring models in Looker
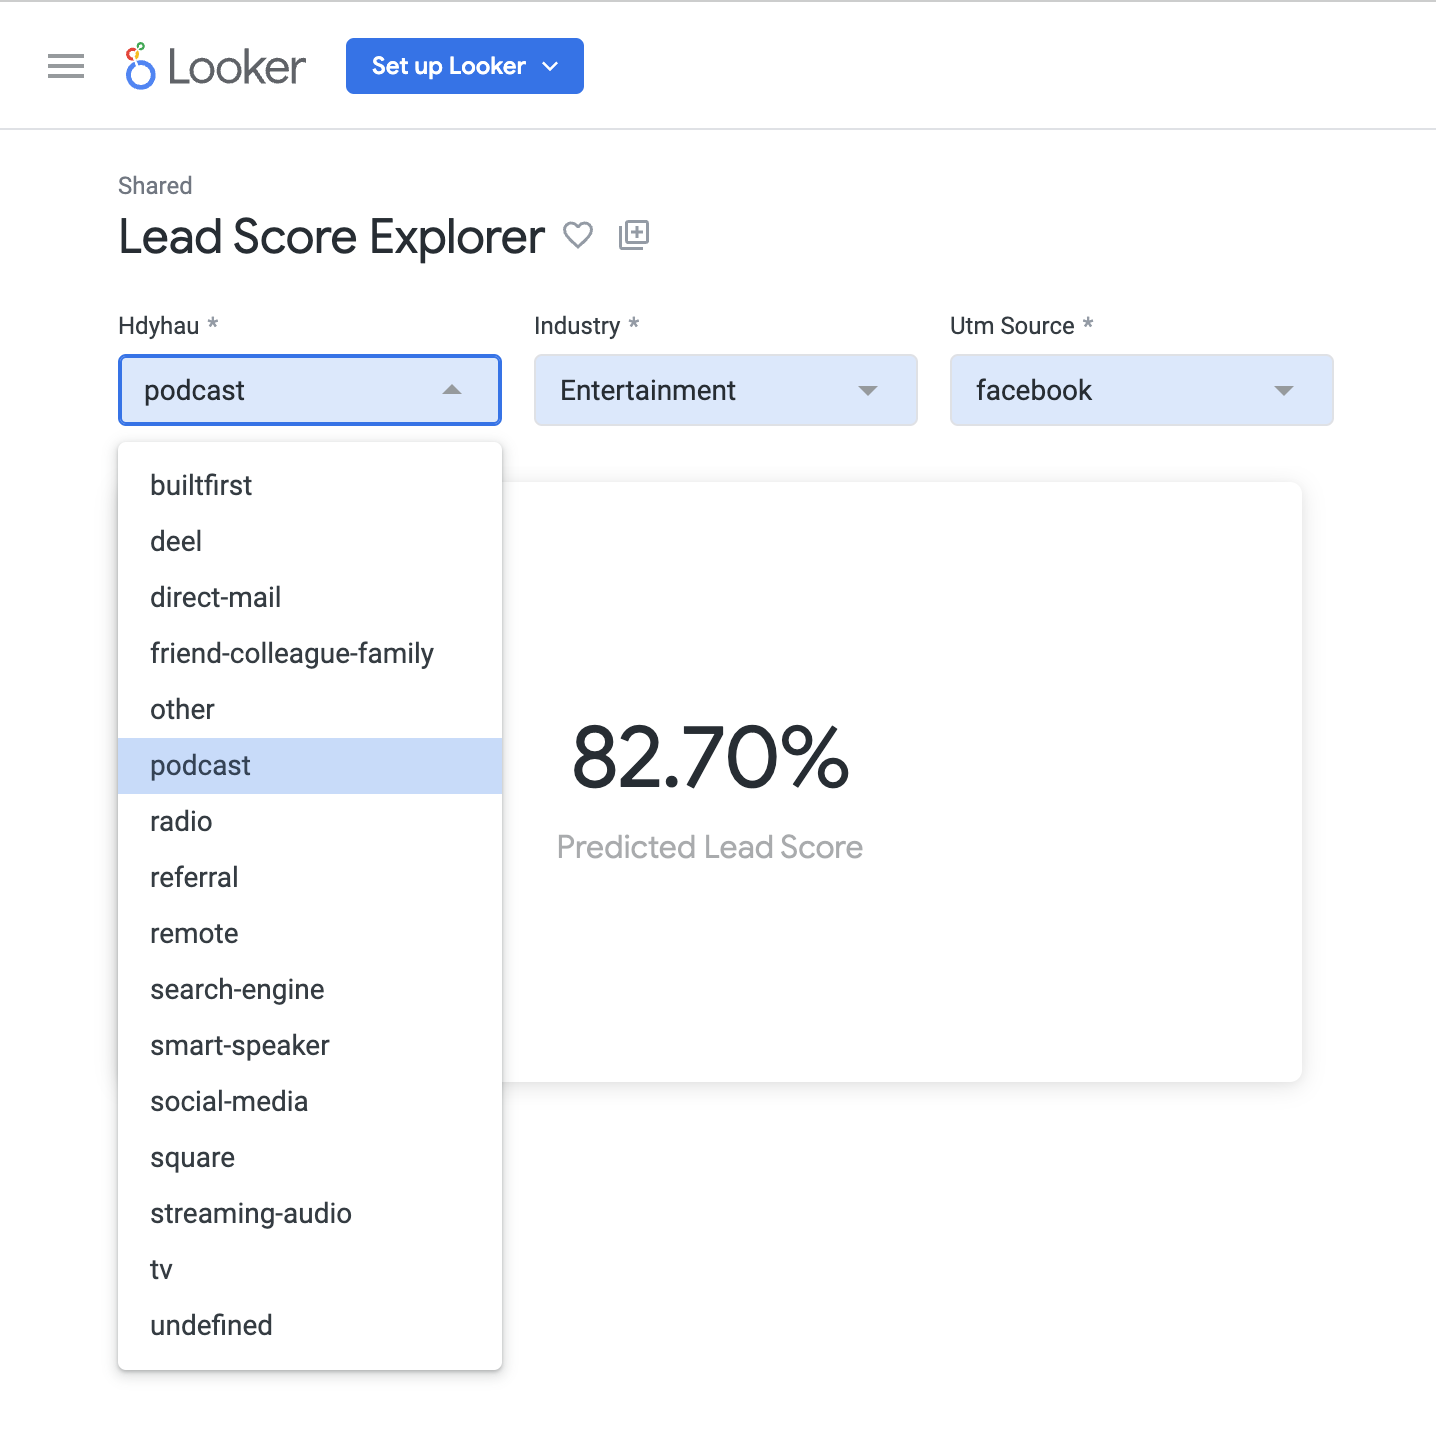
Models deployed with Modelbit can be interactively explored in a BI tool like Looker. For example, if we deploy a lead scoring model with Modelbit, the sales and marketing team can explore the value of potential leads with an interactive dashboard like this one:
Creating a View for your Modelbit model
To start, take your model's SQL function and put it in a view. We'll name this one lead_score.view:
view: lead_score {
  derived_table: {
    sql: select demo_schema.score_lead_latest({
        'UTM_SOURCE': {% parameter utm_source %},
        'INDUSTRY': {% parameter industry %},
        'HDYHAU': {% parameter hdyhau %}
      }) as predicted_lead_score
       ;;
  }

  parameter: utm_source {
    type:  string
    suggest_dimension: leads.utm_source
  }

  parameter: industry {
    type:  string
    suggest_dimension: leads.industry
  }

  parameter: hdyhau {
    type:  string
    suggest_dimension: leads.hdyhau
  }

  dimension: predicted_lead_score {
    type: string
    sql: ${TABLE}."PREDICTED_LEAD_SCORE" ;;
  }

  set: detail {
    fields: [predicted_lead_score]
  }
}
The parameter names in the jinja syntax (e.g. {% parameter utm_source %}) map to the parameter fields. They can be any type.
The suggest_dimension fields inside of parameter are optional. They are there to have Looker create SQL that includes suggestions in the dropdowns.
Without them, the dropdowns will become freeform text fields.
Make sure you include one dimension that is the name of the column returned by your SQL function. In our example that's predicted_lead_score.
Adding your view to a Looker Model
In any Looker model, add the view you just created. E.g., in your_model.model, add:
explore: lead_score {}
If you used suggest_dimension fields to make dropdown suggestions, add the table(s) they are coming from as join relationships.
In our example, we would update the line in your_model.model like so:
explore: lead_score_view {
  join: leads {}
}
You don't need to specify a join route. You can now push these changes to production in Looker.
Creating a chart
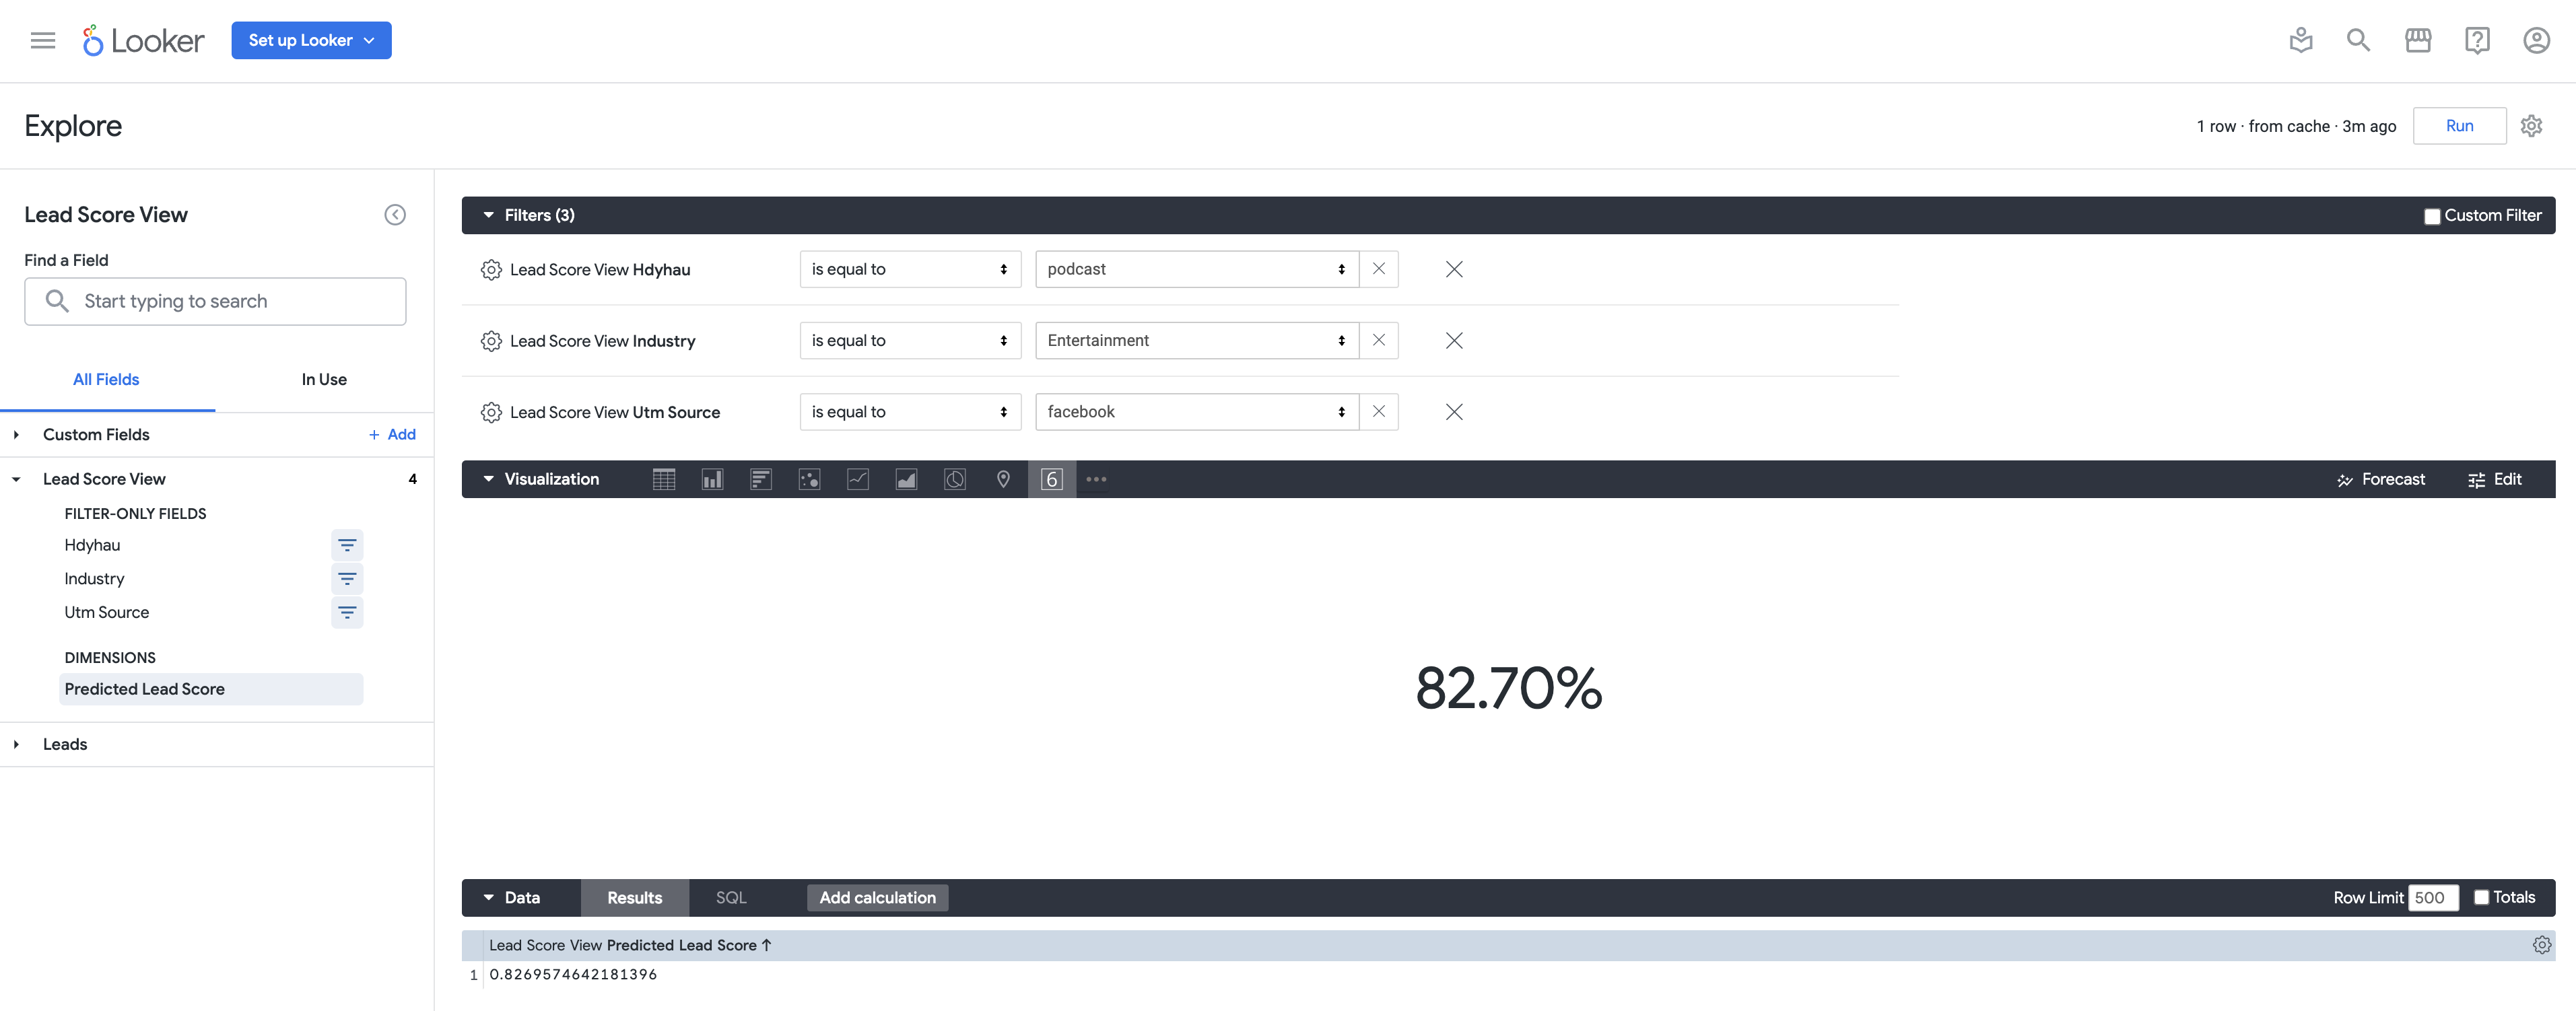
Head to Looker's Explore area and click the name of your view (in our example, "Lead Score"). Click the one dimension from the view to add to the chart. (We called in "Predicted Lead Score.") Click the three-line filter icon next to each of the parameters you made, now referred to as "Filter-Only Fields."
Here's what that looks like:
Click the gear icon in the upper-right and click "Save..." and "As a new dashboard."
If you like, edit each of the filters to give them a pretty name and change "Control" to "Dropdown Menu." Then save your dashboard and explore your model!